


DALLAS, Aug. 02, 2018 (GLOBE NEWSWIRE) — Wingstop Inc. (NASDAQ: WING) today announced fiscal second quarter financial results for the period ended June 30, 2018.
Highlights for the Fiscal Second Quarter 2018 compared to the Fiscal Second Quarter 2017*:
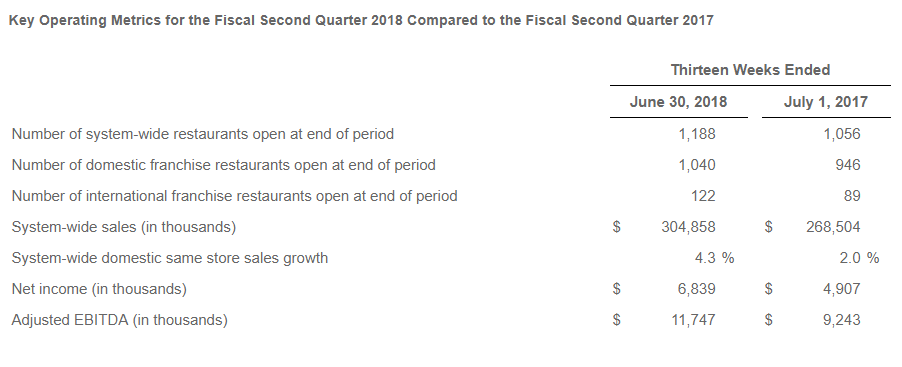
- System-wide sales increased 13.5% to $304.9 million
- System-wide restaurant count increased 12.5% to 1,188 global locations
- System-wide domestic same store sales increased 4.3%
- Total revenue increased 17.3% to $37.0 million
- Net income increased 39.4% to $6.8 million, or $0.23 per diluted share, compared to $4.9 million, or $0.17 per diluted share
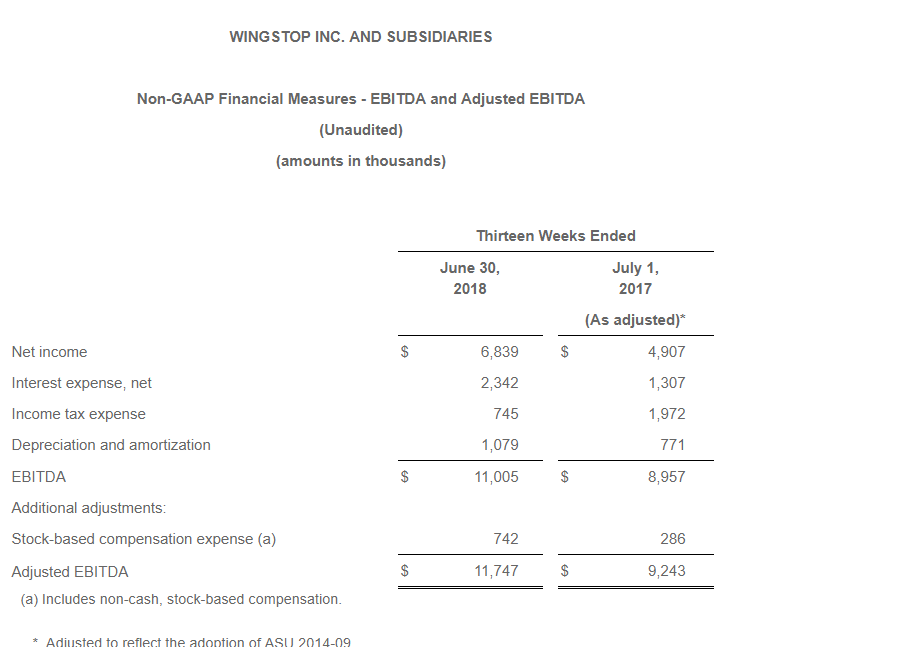
- Adjusted EBITDA**, a non-GAAP measure, increased 27.1% to $11.7 million
* In the first quarter of 2018, the Company adopted Accounting Standards Update No. 2014-09, Revenue from Contracts with Customers (Topic 606), which changed the timing of recognition of initial franchise fees, development fees, territory fees for our international business and renewal and transfer fees, as well as the reporting of advertising fund contributions and related expenditures. See the “Adoption of New Accounting Guidance” section below for additional information. Amounts presented for the thirteen weeks ended July 1, 2017 have been adjusted to reflect the adoption of ASU 2014-09.
** Adjusted EBITDA is a non-GAAP measure. A reconciliation of adjusted EBITDA to the most directly comparable financial measure presented in accordance with GAAP is set forth in a schedule accompanying this release. See “Non-GAAP Financial Measures.”
Chairman and Chief Executive Officer Charlie Morrison stated, “Wingstop completed another strong quarter of growth on both the top and bottom lines as we continue positioning ourselves to become a top 10 global restaurant brand. We are effectively executing against our four growth strategies: building greater awareness through national advertising, innovating through technology to enhance the guest experience, optimizing delivery in test markets ahead of a national roll out in 2019, and expanding our international presence.”
Morrison continued, “We believe that raising our quarterly dividend demonstrates the strength of our overall business, our commitment to shareholder value and our confidence in future performance.”
Fiscal Second Quarter 2018 Financial Results
Total revenue for the fiscal second quarter 2018 increased 17.3% to $37.0 million from $31.6 million in the fiscal second quarter last year.
- Royalty revenue, franchise fees and other increased $1.9 million to $17.2 million from $15.3 million in the fiscal second quarter last year. Royalty revenue increased $1.8 million primarily due to 127 net franchise restaurant openings since July 1, 2017 and domestic same store sales growth of 4.3%.
- Advertising fees and related income increased $0.9 million to $8.4 million from $7.5 million in the fiscal second quarter last year. Advertising fees increased primarily due to the increase in system-wide sales in the thirteen weeks ended June 30, 2018, compared to the prior year fiscal second quarter.
- Company-owned restaurant sales increased $2.6 million to $11.5 million from $8.8 million in the fiscal second quarter last year. The increase was primarily due to the acquisition of five franchised restaurants since the prior year comparable period resulting in additional sales of $2.3 million in the current fiscal second quarter. The remaining increase is due to company-owned domestic same store sales growth of 3.5%, which was driven by an increase in average transaction size.
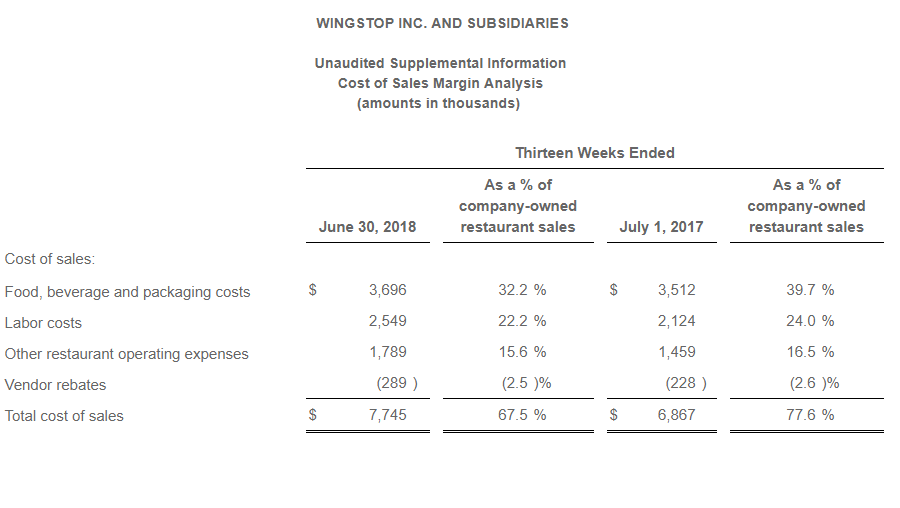
Cost of sales increased to $7.7 million from $6.9 million in the fiscal second quarter last year. As a percentage of company-owned restaurant sales, cost of sales decreased to 67.5% from 77.6%. The decrease was driven primarily by a 22.9% decrease in the cost of bone-in chicken wings as compared to the prior year period, as well as our ability to leverage costs due to the 3.5% increase in company-owned restaurant same store sales.
Advertising expenses increased to $8.2 million from $7.6 million in the fiscal second quarter last year. Under the new accounting guidance, advertising expenses are recognized at the same time the related revenue is recognized, which does not necessarily correlate to the actual timing of the advertising spend.
Selling, general & administrative expenses (“SG&A”) increased 23.2% to $10.1 million compared to $8.2 million in the fiscal second quarter last year. The increase in SG&A expense is primarily due to an increase in payroll and benefit expenses related to planned headcount additions, as compared to the prior year period.
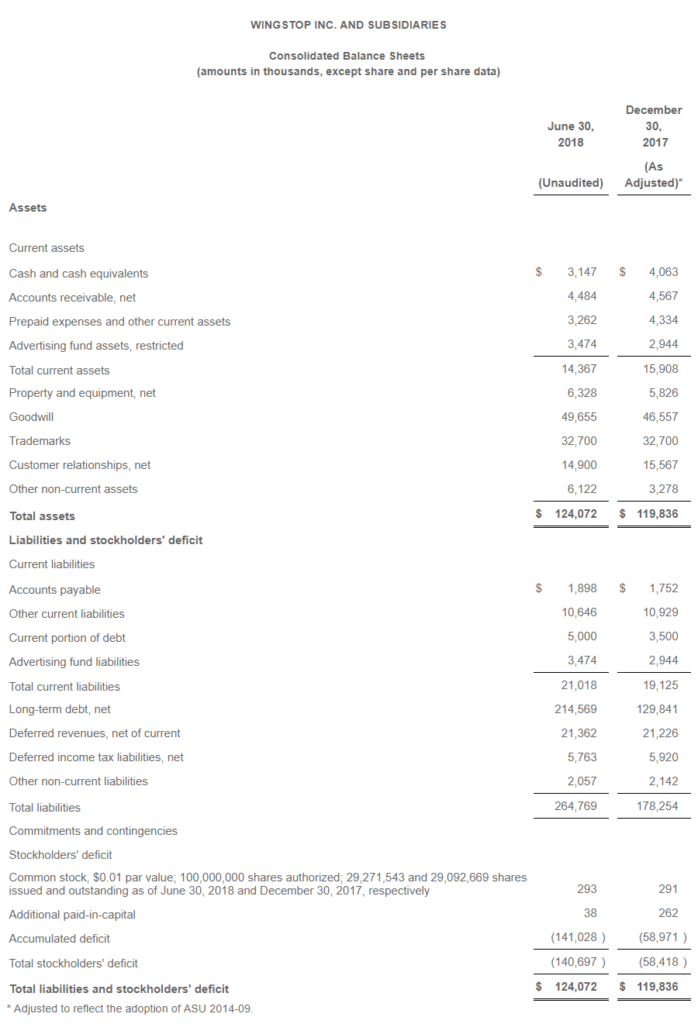
Net income increased 39.4% to $6.8 million, or $0.23 per diluted share, compared to net income of $4.9 million, or $0.17 per diluted share, in the fiscal second quarter last year.
Adoption of New Accounting Guidance
The Company adopted ASU 2014-09 in the first quarter of 2018, using the full retrospective transition method, which resulted in adjusting each prior reporting period presented and a recording a cumulative effect adjustment as of the first day of 2016. The adoption changed the timing of recognition of initial franchise fees, development fees, territory fees for our international business and renewal and transfer fees, as well as the reporting of advertising fund contributions and related expenditures. Additional information regarding the Company’s adoption of the new revenue recognition guidance and the impact to historical financial results is contained in Exhibit 99.2 to the Company’s current report on Form 8-K, filed with the Securities and Exchange Commission on February 22, 2018.
Restaurant Development
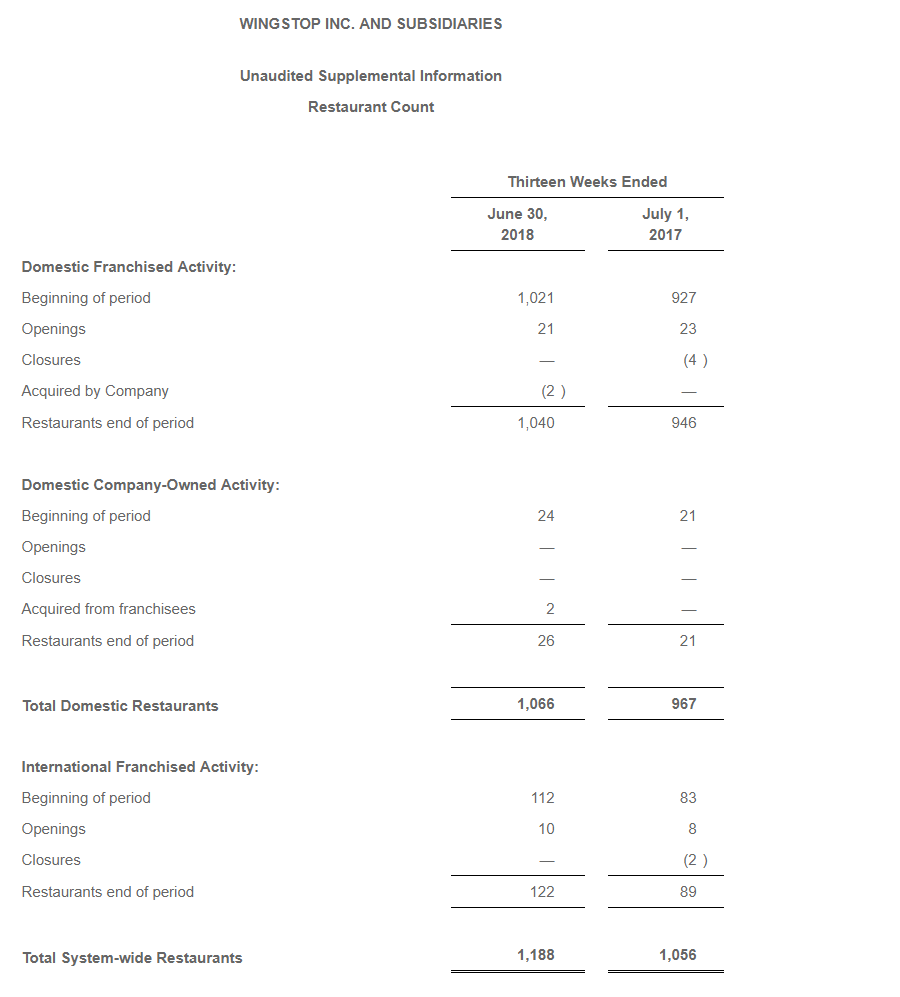
As of June 30, 2018, there were 1,188 Wingstop restaurants system-wide. This included 1,066 restaurants in the United States, of which 1,040 were franchised restaurants and 26 were company-owned. Our international presence consisted of 122 franchised restaurants across nine countries. During the fiscal second quarter 2018, there were 31 net system-wide Wingstop restaurants opened, including 10 international franchised locations.
Appointment of Independent Board Member
On August 1, 2018, the Board of Directors elected Krishnan (“Kandy”) Anand, an experienced public company director and the Chief Growth Officer of Molson Coors Brewing Co. (NYSE:TAP), to the Board as a new independent Director. Mr. Anand served on the Popeyes Louisiana Kitchen, Inc. board from November 2010 to April 2017. Prior to his current role at Molson Coors, Mr. Anand served as President and Chief Executive Officer of Molson Coors International from December 2009 to October 2016. Before joining Molson Coors, Mr. Anand held a variety of positions at The Coca Cola Company, most recently as president of Coca Cola’s Philippine business from 2007 to 2009. He also served as Vice President of Coca Cola’s Global Commercial Leadership from 2004 to 2007, and prior to that as Vice President of Global Brands Strategy.
Quarterly Dividend
In recognition of the Company’s strong cash flow generation, confidence in the business, and commitment to returning value to shareholders, our Board of Directors approved a 29% increase in the quarterly dividend payable to Wingstop shareholders from $0.07 to $0.09 per share of common stock, totaling approximately $2.6 million. This dividend will be paid on September 18, 2018 to shareholders of record as of September 4, 2018.
Financial Outlook
The Company is confirming our long-term guidance of low single digit domestic same store sales growth and 10%+ system-wide unit growth. For the fiscal year ending December 29, 2018, the Company is reiterating previous guidance, which is consistent with its long-term targets, with the exception of updating certain items impacting fully diluted Adjusted earnings per share:
- Depreciation and amortization of approximately $4.5 million, reflecting the impact of amortization of reacquired franchise rights associated with restaurant acquisitions
- An on-going effective tax rate of approximately 25% (previously 23%), excluding the impact of excess tax benefits from stock option exercises
- Stock-based compensation expense of approximately $3.7 million (previously $3.0 million)
Additionally, we expect unit development growth will be between 12.0 – 12.5%.
A reconciliation of diluted earnings per share to Adjusted diluted earnings per share is provided below, which reflects 29.6 million diluted shares outstanding. This estimate is comparable to fully diluted Adjusted earnings per share of $0.69 for fiscal year 2017, which has been restated to reflect the new revenue recognition standards. Fiscal year 2017 included a benefit of $0.08 to Adjusted earnings per share associated with excess tax benefits for stock options exercised. Our 2018 guidance includes a benefit of $0.05 to Adjusted earnings per share due to excess tax benefits realized in the first two quarters of 2018.

(a) Represents costs and expenses related to the refinancing of our credit agreement
(b) Tax impact of adjustment calculated at a 25% effective tax rate.
The following definitions apply to these terms as used in this release:
Same store sales reflects the change in year-over-year sales for the comparable restaurant base. We define the comparable restaurant base to include those restaurants open for at least 52 full weeks. This measure highlights the performance of existing restaurants, while excluding the impact of new restaurant openings and closures.
System-wide sales represents net sales for all of our company-owned and franchised restaurants, as reported by franchisees.
Adjusted EBITDA is defined as net income before interest expense, net, income tax expense, and depreciation and amortization (EBITDA) further adjusted for transaction costs, gains and losses on the disposal of assets, and stock-based compensation expense. We caution investors that amounts presented in accordance with our definitions of EBITDA and Adjusted EBITDA may not be comparable to similar measures disclosed by our competitors, because not all companies and analysts calculate EBITDA and Adjusted EBITDA in the same manner.
Conference Call and Webcast
Chairman and Chief Executive Officer, Charlie Morrison, and Chief Financial Officer, Michael Skipworth, will host a conference call today to discuss the fiscal second quarter and fiscal year 2018 financial results at 4:30 PM Eastern Time.
The conference call can be accessed live by dialing 604-235-2082. A replay will be available two hours after the call and can be accessed by dialing 412-317-6671; the passcode is 10005248. The replay will be available through Thursday, August 9, 2018.
The conference call will also be webcast live and later archived on the investor relations section of Wingstop’s corporate website at ir.wingstop.com under the ‘News & Events’ section.
About Wingstop
Founded in 1994 and headquartered in Dallas, Texas, Wingstop Inc. (NASDAQ:WING) operates and franchises more than 1,100 restaurants across the United States, Mexico, Singapore, the Philippines, Indonesia, the United Arab Emirates, Malaysia, Saudi Arabia, Colombia, and Panama. The Wing Experts’ menu features classic and boneless wings with 11 bold, distinctive flavors including Original Hot, Cajun, Atomic, Mild, Teriyaki, Lemon Pepper, Hawaiian, Garlic Parmesan, Hickory Smoked BBQ, Louisiana Rub, and Mango Habanero. Wingstop’s wings are always cooked to order, hand-sauced and tossed and served with a variety of house-made sides including fresh-cut, seasoned fries. Having grown its domestic same store sales for 14 consecutive years, the Company has been ranked #3 on the “Top 100 Fastest Growing Restaurant Chains” by Nation’s Restaurant News (2016), #7 on the “Top 40 Fast Casual Chains” by Restaurant Business (2016), and was named “Best Franchise Deal in North America” by QSR magazine (2014). Wingstop was ranked #88 on Fortune’s 100 Best Medium Workplaces list in October 2016. For more information visit www.wingstop.com or www.wingstopfranchise.com. Follow us on facebook.com/Wingstop and Twitter @Wingstop.
Non-GAAP Financial Measures
To supplement our consolidated financial statements, which are prepared and presented in accordance with GAAP, we use non-GAAP financial measures including those indicated above. By providing non-GAAP financial measures, together with a reconciliation to the most comparable GAAP measure, we believe we are enhancing investors’ understanding of our business and our results of operations, as well as assisting investors in evaluating how well we are executing our strategic initiatives. These measures are not intended to be considered in isolation or as substitutes for, or superior to, financial measures prepared and presented in accordance with GAAP. The non-GAAP measures used in this press release may be different from the measures used by other companies. A reconciliation of each measure to the most directly comparable GAAP measure is available in this news release. In addition, the Current Report on Form 8-K furnished to the SEC concurrent with the issuance of this press release includes a more detailed description of each of these non-GAAP financial measures, together with a discussion of the usefulness and purpose of such measures.
Forward-looking Information
Certain statements contained in this news release, as well as other information provided from time to time by Wingstop Inc. or its employees, may contain forward-looking statements that involve risks and uncertainties that could cause actual results to differ materially from those in the forward-looking statements. You can identify forward-looking statements by the fact that they do not relate strictly to historical or current facts. These statements may include words such as “guidance,” “anticipate,” “estimate,” “expect,” “forecast,” “outlook,” “target,” “project,” “plan,” “intend,” “believe,” “confident,” “may,” “should,” “can have,” “likely,” “future” and other words and terms of similar meaning in connection with any discussion of the timing or nature of future operating or financial performance or other events. Examples of forward-looking statements in this news release include our fiscal year 2018 outlook for new restaurant openings, domestic same store sales growth, SG&A expenses, net income, EBTIDA, adjusted EBITDA, adjusted net income, adjusted earnings per diluted share and our diluted share count, as well as our anticipated potential domestic restaurant expansion opportunity, positioning to make progress towards domestic restaurant potential, and progress toward our goal of becoming a top 10 global restaurant brand.
Any such forward-looking statements are not guarantees of performance or results and involve risks, uncertainties (some of which are beyond the Company’s control), and assumptions. Although we believe any forward-looking statements are based on reasonable assumptions, you should be aware that many factors could affect our actual financial results and cause them to differ materially from those anticipated in any forward-looking statements. Please refer to the risk factors discussed in our Form 10-K for the year ended December 30, 2017, which can be found at the SEC’s website www.sec.gov. The discussion of these risks is specifically incorporated by reference into this news release.
Any forward-looking statement made by Wingstop Inc. in this press release speaks only as of the date on which it is made. We undertake no obligation to update any forward-looking statement, whether as a result of new information, future developments or otherwise, except as may be required by law.
Media Contact
Brian Bell
972-707-3956
bbell@wingstop.com
Investor Contact
Raphael Gross
203-682-8253
raphael.gross@icrinc.com